In recent months, whilst badgering marine scientists from “all over” with my
concerns about the “starving ocean”, I have been repeatedly informed that one well-known
current phenomenon in the Northwest Atlantic ocean is the recent accumulation of very
large stocks of a couple of “pelagic” fish, specifically herring and mackerel. This is
apparently an “expected” finding based on the predominant “species replacement theory”
and the recent disappearance of most of the groundfish in the area. Since (according to the
theory) it is assumed that the total amount of fish in the sea (“biomass”) remains the same,
“logic” then dictates that there must now be lots of herring and mackerel out there. Both of
these fish are harder to “count” than other types (e.g. groundfish abundance estimates can
be made fairly reliably from survey trawls), so there is more uncertainty about the numbers
of herring and mackerel due to the lifestyle habits of these fish. But “rumour” certainly has
it that herring and mackerel stocks are currently at very high levels. Is this based on solid
facts (i.e. actual observations and fish counts) or has the “rumour of high
biomass/abundance” somehow been deduced from other, more indirect information? In
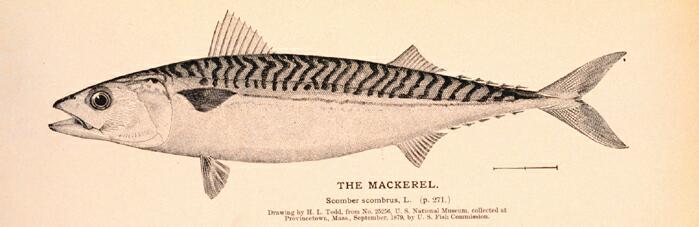
this essay I will focus on the mackerel, aka “Scomber scombrus.”
The mackerel rumour is very widespread...although the mackerel itself may be a
different story. In the course of a discussion on the changes in the marine ecosystem as a
whole, it has been suggested to me that the unusually abundant mackerel stocks are
probably one factor inhibiting the groundfish recovery. The reasoning is that the mackerel
(primarily a plankton feeder) are eating major quantities of the planktonic larvae of the
groundfish. It also came up in a discussion about the reasons for the apparent current
malnourished state of the northern right whales...that hordes of mackerel are competing for
the same food as the whales, and thereby contributing to their decline. Relative continued
success of mackerel would be expected, even by myself, at this time due to the scarcity of
their natural predators (e.g. cod) and the fact that they feed at a very low point in the food
web (plankton)...but I now seriously doubt the true extent of their “success” at this time.
So what do we know about “Scomber scombrus?” And how do we determine how
many of them are in the sea? Mackerel are migratory fish that normally travel long
distances on an annual basis. They also have a preference for warmer water temperatures
so their appearance in an area generally coincides with that particular “environmental
factor.” So it is not entirely predictable that schools of mackerel will be or “should be” in
certain places at certain times - their movements are variable. What mackerel do
consistently, however, is use the same spawning grounds year after year. Based on this
knowledge, surveys of egg abundance are done in these areas, during the spawning season,
every second year (by DFO) as a method of estimating “spawning stock biomass.” This
appears to be one reasonable approach to assessing a fish stock like this one. Another thing
that is recorded is “landings” - but that’s an unreliable way to estimate the actual stock
abundance due to numerous other factors that affect how many mackerel are caught,
including variable degrees of fishing effort and changing market conditions. “Landings,”
nevertheless, still do provide one part of the picture.
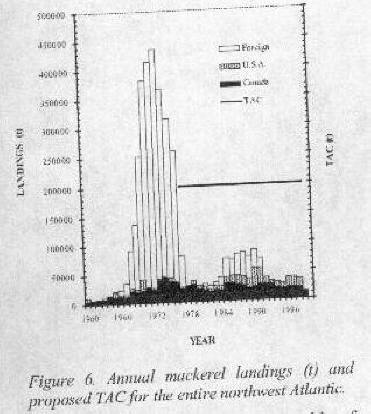
Do recent records of mackerel landings indicate the presence of an unusually high
abundance or “biomass?” NO, landings have been declining in most areas over the last
decade. And these landings have only been a small fraction (less than 1/10 th) of the record
high landings that were caught during the “great foreign fishery” of the late 1960s and early
1970s. Although not at all conclusive, this contrast seems to imply that the mackerel
biomass “may” have been significantly higher several decades ago than it is now.
The recently collected landings statistics do not include a few sectors of the fishery,
notably mackerel caught by anglers (“tourists”) and mackerel caught for bait. At least in
some areas of Nova Scotia, the bait mackerel fishery has been a complete failure in recent
years. This is far from “conclusive,” but, at least on the surface, it does not appear to
support the “very large mackerel biomass” contention.
So what have been the recent results of the egg abundance surveys? Were
higher-than-normal numbers of mackerel eggs discovered in the spawning areas? Strangely,
the answer is again “NO,” quite the opposite has been found in fact. The results are
described in DFO’s Science document “Atlantic Mackerel of the Northwest Atlantic -
Stock Status Report B4-04 (2000)” On page 2, regarding the egg surveys: “Spawning
biomass increased between 1983 and 1988 before shrinking and stabilizing between 1990
and 1994. Values obtained in 1996 and 1998 are LOWEST in the series...” The
explanation for the low egg count in 1996 is that the survey was ill-timed due to “technical
problems” and therefore “did not coincide with the peak spawning period.” Fair enough, so
no good conclusions can be drawn from the 1996 data...which certainly CANNOT be
interpreted to demonstrate a high level spawning biomass. In 1998, however, the egg
survey also came up with low numbers of mackerel eggs. There were no technical
problems this time, but the low egg count was explained on the basis that it appeared that
the mackerel had begun to spawn much earlier than usual and therefore the egg “peak” had
again been missed by the survey crew. How could results like these possibly have been
translated into the “rumour” of very highly abundant mackerel?
I think it must have happened because of an intense wish for it to be true. “Species
replacement theory” for one, almost demanded that there be a “large biomass” of mackerel
in the Northwest Atlantic at this time. The stock status report (2000) describes a new
mathematical model that was used to calculate the mackerel biomass. Called the “Daily
Fecundity Reduction Method” (DFRM), it was meant to “correct the lack of synchronism
between the spawn and the survey.” The result was that the “new math” found 2 1/2 times
as many mackerel in the ocean as did the “old math”...hence there is a “large biomass” of
mackerel in the area at the present time. And THAT is how rumours get started...nevermind
that the “DFRM” has yet to receive “final approval” (p 9)...
So, calculations aside, what else has actually been OBSERVED about the mackerel in
recent years?
Well, the experience of my friends who were unable to catch the usual
bait-mackerel for their lobster fishery...apparently was not unique to them alone. According
to the DFO document, concern about the patchy appearance of mackerel was also voiced
by fishermen in the Gulf area: “...the abundance of mackerel in certain places only, but not
throughout the Gulf.” For some reason these fishermen also felt a concern about “the
danger of overfishing the resource.” I have to wonder what “signs” those fishermen were
reading, because, unlike DFO, I definitely agree with them on this point of concern.
Mackerel roe (eggs) is considered a delicacy in certain circles. But last year it
proved to be impossible to find any “decent” roe to eat - the problem was that the roe was
uncommonly small, thin and “bloody.” I heard this complaint locally from older people
who have “cut roe” and eaten it for over 60 years. The mackerel roe in 1999 was the
poorest that they had ever seen.
What observations did the scientists make about the mackerel roe last year?
Apparently mackerel are “multiple spawners,” which means that they spawn repeatedly
during their reproductive season, therefore not releasing all of their eggs at a single time. So
as the spawning season progresses it is normal to find fewer and fewer eggs/fish, i.e.
smaller and smaller size roe. Scientists do pay attention to the size of the roe and they look
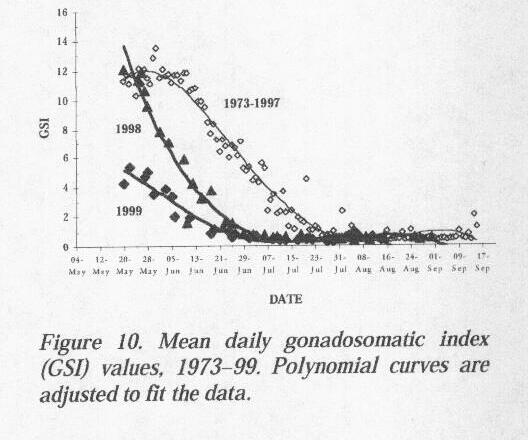
at it in relation to the size of the fish overall. A statistic called “gonadosomatic index” (GSI)
captures this information. In the mackerel stock survey report that I have been referring to,
trends in “GSI” from 1973-1999 are illustrated in Figure 10. This graph deserves a VERY
close look. It shows that in the last two years there has been a drastic departure from the
earlier normal pattern in the GSI. Even worse, it shows a major negative change between
the last two years, 1998 and 1999.
The usual peak for GSI (1973-1997 average) is about 12%, and the peak normally
occurs in late May-early June. After the peak, GSI tapers downward (demonstrating half of
a bell-curve) and normally bottoms out late in July, at which point the spawning season has
ended. The data for the years 1973-1997 was able to be nicely approximated by a single
curve. In 1998 the GIS peaked at the same level (12%) and at almost the same time as in
previous years (late May), the real difference being in the steepness with which the curve
dropped, so that it bottomed out (spawning came to an end) significantly earlier (late June
vs the traditional late July). So the mackerel released their eggs more quickly than usual in
1998, in fact they were finished a whole month earlier than usual. What conclusions can be
drawn from this, or what does it suggest about changes in the ecosystem or in the mackerel
stock?
The proposed explanation in the literature is that the spawning occurred much
earlier than usual because the water was warmer than normal. This could reasonably be a
factor, but the sudden change between 1997 and 1998 does not really correlate to a
“sudden” increase in water temperature...temps in the late 1990’s have all been warmer on
average than temps in the early 1990s. Could any other “environmental factor” be
presumed to have an effect on the timing and the duration of mackerel spawning? This is
speculation of course, based on my different interpretation of the trends in the system
overall, but I would suggest that if mackerel were experiencing a shortage of energy stores,
they might reasonably release their eggs earlier and more quickly than usual. Why?
Because it seems that they do not commence feeding until they have finished spawning.
Once they start feeding, mackerel store energy to carry them through the winter and the
next spawning season. (Mackerel are well known to be thinnest in the spring and fattest in
the fall. Anyone who cooks them is well aware of how much fat is usually rendered out
when using “fall mackerel.”) The need to spawn earlier because of an urgent need to start
feeding, a result of overall “hunger” in the ocean, I think is a plausible part of the
explanation...although it is certainly not “proven” yet.
What happened in 1999? Well, despite the clue from 1998 that mackerel were
spawning earlier than usual, the DFO data collected in 1999 still missed the “peak.” Whoever
scheduled the fishery and collected the data didn’t anticipate the further changes in the pattern that occurred in
1999. The “GIS” data from 1999 look dramatically different from usual, even from the
1998 pattern. In 1999 the peak recorded GIS is less than 6% (vs 12% in all previous
years)! The graph then slopes downward and bottoms out in late June, the same time as the
1998 line. From what I can tell, the official interpretation of this is that spawning occurred
much earlier than usual in 1999 and that the GIS data therefore only shows the tail end of a
more or less normal graph (one with a 12% peak sloping to 0). This is wrong, however,
because the slopes are different. The “6% to zero” graph in 1999 is not the same as the last
half of the “12% to zero’ graph that always described the usual pattern. The 1999 graph
also looks like “half of a bell curve” to me, just one that peaked at a much lower level - at
only 6%. If that is true, the interpretation of stock trends becomes very different. “If” the
GIS peaked at 6%, it means that the reproductive potential of the Atlantic mackerel is
becoming seriously compromised. I am concerned that the interpretation of the data from
1999 was based on an “assumption” that GIS reached an earlier high point, although there
was no direct evidence to support that conclusion.
Are the mackerel showing signs of hunger or malnutrition? Maybe. The DFO
document states: “In 1999, spawning occurred so early that feeding and growth began
earlier than expected, as confirmed by a growth zone on the edge of the otoliths as early as
June. The growth zone for the current year does not usually start to be deposited until the
end of July.”
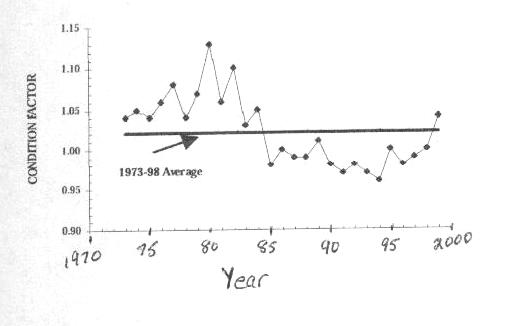
I have been told that the best statistic to look for when trying to prove the existence
of “food shortage” is the “condition factor” in fish. (This involves a weight to length ratio
and amounts to an index of “plumpness.”) A steady downward trend in condition would be
consistent with steadily worsening feeding conditions. The latest report on the Atlantic
mackerel includes the trend in “condition factor” from 1973-1999 (Figure 4). A horizontal
line indicates the 1973-1998 average. “The condition of mackerel is at its lowest in early
spring, just before and during spawning, while peak values are observed in fall. Up until
and including 1984, the condition of mackerel on arrival in the Gulf was above the mean
for 1973 to 1998 (Figure 4), but it fell below that mean between 1985 and 1998, a time
when the Gulf water was cooling down. In 1999, it once again rose above the mean.” For
consistency, the condition factor is calculated at the same time every year, in June. If for
some reason the condition factors for the last two years could be removed from the graph,
it would show a steady declining trend for a couple of decades. And the condition data
from 1998 and 1999 should be removed from this graph for a reason that has already been
described: “feeding and growth began earlier than expected...as early as June...” (All
years except 1998 and 1999 show the condition of mackerel at their annual low point, in
the last two years the “condition” reflects fish that have already started feeding - so, no
comparison can be made.) Therefore a strong argument can be made that feeding
conditions (reflected in “condition factor”) for mackerel in the Northwest Atlantic have in
fact been steadily worsening for at least two decades...which is completely consistent with
the “overall biomass depletion/starvation” theory.
Two other growth indicators in fish are “weight-at-age” and “length-at-age,” and
these are mentionned under “attributes of the stock.” The current situation is described as
“Slow growth seen in year-classes from late 1990s.” It is very bothersome to me, however,
to find this next comment under “recent trend” - “Growth of year-classes is inversely
proportional to their abundance.” That last statement describes a principle that USED to
be true for all fish stocks, but has no longer been true since the mid-1980s. Groundfish,
salmon, whatever was fished...it was commonly noted that in years when the numbers were
fewer that the individual fish grew better, presumably a result of fewer mouths competing
for the same amount of food. Inversely, years in which fish were very abundant were the
same years when individual fish were noticeably smaller. But it is a well known fact that
this predictable relationship “fell apart” about 15 years ago... stocks now have low
abundance and slow growth simultaneously (e.g. cod, haddock, pollock). It is a newer
trend, and to me an alarming one. It is one of the main puzzles that marine biologists have
been trying to decipher in recent years. Why would the statement of the OLD
inverse-proportion principle be included in a "2000" fish stock assessment? I only hope that it
was not one of the mistaken lines of reasoning that led to the rumour of “abundant
mackerel” (...if they are growing slowly, then there must be lots of them...).
What other bits of information do we have about the mackerel? Figure 7 in the
Stock status report shows “annual length frequency distributions” with straight lines
approximating the growth trends of three recently dominant year classes, 1974, 1982 and
1988. Even the naked eye can see the increasing slope in these growth lines, indicating that
as time goes on, mackerel are growing ever more slowly. Although it may be a rough
approximation, this graph would indicate that an 8 year old mackerel caught in 1996 was
14 1/2 inches long, and an 8 year old caught in 1982 was an average of 15 inches long.
Insignificant? Maybe, but a look at an older reference (DFO, 1966) gives the average
length of an 8 year old mackerel as “just under 18 inches long”...and that’s definitely a
significantly bigger fish! This comparison of lengths is not conclusive, however, and there
is a widely held belief that fish are smaller these days because of a “size-selective culling
effect” of fishing gear. There may or may not be truth in that idea, but the facts about
trends in fish growth at least appear to also be consistent with a theory of gradual and
steadily worsening feeding conditions. There is a point at which “less food” will surely
result in “less growth,” that much has to be true. On the other hand, I fail to see how
“fishing gear” could lead to impaired reproduction...
(One more observation - Figure 11 in the Mackerel status paper describes a recent shift in the location of the mackerel egg concentration in the Gulf of St. Lawrence. From everything that I have read fish are very faithful to their traditional spawning grounds and there must be a good reason (survival?) for this. DFO proposes no reason for the shift in the location of the eggs, but I do. They migrate in from offshore before spawning, if they didn't have enough energy stored to reach their usual spawning ground - they might be forced to release their eggs when they are "almost there" - does anyone else see what I see?)
My father is a “senior citizen” who has seen a lot of things in his day, including a
lot of fish. He makes the best-ever smoked mackerel in his little smokehouse. The fat fall
mackerel are by far the favorites for this purpose, and last year he smoked some as per
usual. They were good, but...my father found it strange that the usual quantity of fat did
not drip out of the mackerel in the smokehouse last year. Another clue? Maybe.
Regardless, he insists that this year’s mackerel fishery will be the one that “tells the tale.” I
believe he is right, and I will keep you posted.
Debbie MacKenzie
May 7, 2000
(These two illustrations show the proportional size difference between a mackerel that is 14.5 inches long and one that is 18 inches long.)
References:
DFO 2000, “Atlantic Mackerel of the Northwest Atlantic,” DFO Science Stock Status
Report B4-04 (2000). (This is available on the internet as a pdf document at:
http://www.dfo-mpo.gc.ca/csas/csas/status/2000/b4-04e.pdf The three graphs reproduced above are from this paper.
)
Leim, A. H. and Scott, W. B. Fishes of the Atlantic Coast of Canada. Fisheries Bulletin
No. 155. Ottawa: Fisheries Research Board of Canada, l966
Mackerel illustration from NOAA's historical collection.

 Both of
these fish are harder to “count” than other types (e.g. groundfish abundance estimates can
be made fairly reliably from survey trawls), so there is more uncertainty about the numbers
of herring and mackerel due to the lifestyle habits of these fish. But “rumour” certainly has
it that herring and mackerel stocks are currently at very high levels. Is this based on solid
facts (i.e. actual observations and fish counts) or has the “rumour of high
biomass/abundance” somehow been deduced from other, more indirect information? In
this essay I will focus on the mackerel, aka “Scomber scombrus.”
Both of
these fish are harder to “count” than other types (e.g. groundfish abundance estimates can
be made fairly reliably from survey trawls), so there is more uncertainty about the numbers
of herring and mackerel due to the lifestyle habits of these fish. But “rumour” certainly has
it that herring and mackerel stocks are currently at very high levels. Is this based on solid
facts (i.e. actual observations and fish counts) or has the “rumour of high
biomass/abundance” somehow been deduced from other, more indirect information? In
this essay I will focus on the mackerel, aka “Scomber scombrus.”
 Do recent records of mackerel landings indicate the presence of an unusually high
abundance or “biomass?” NO, landings have been declining in most areas over the last
decade. And these landings have only been a small fraction (less than 1/10 th) of the record
high landings that were caught during the “great foreign fishery” of the late 1960s and early
1970s. Although not at all conclusive, this contrast seems to imply that the mackerel
biomass “may” have been significantly higher several decades ago than it is now.
Do recent records of mackerel landings indicate the presence of an unusually high
abundance or “biomass?” NO, landings have been declining in most areas over the last
decade. And these landings have only been a small fraction (less than 1/10 th) of the record
high landings that were caught during the “great foreign fishery” of the late 1960s and early
1970s. Although not at all conclusive, this contrast seems to imply that the mackerel
biomass “may” have been significantly higher several decades ago than it is now.
 What observations did the scientists make about the mackerel roe last year?
Apparently mackerel are “multiple spawners,” which means that they spawn repeatedly
during their reproductive season, therefore not releasing all of their eggs at a single time. So
as the spawning season progresses it is normal to find fewer and fewer eggs/fish, i.e.
smaller and smaller size roe. Scientists do pay attention to the size of the roe and they look
at it in relation to the size of the fish overall. A statistic called “gonadosomatic index” (GSI)
captures this information. In the mackerel stock survey report that I have been referring to,
trends in “GSI” from 1973-1999 are illustrated in Figure 10. This graph deserves a VERY
close look. It shows that in the last two years there has been a drastic departure from the
earlier normal pattern in the GSI. Even worse, it shows a major negative change between
the last two years, 1998 and 1999.
What observations did the scientists make about the mackerel roe last year?
Apparently mackerel are “multiple spawners,” which means that they spawn repeatedly
during their reproductive season, therefore not releasing all of their eggs at a single time. So
as the spawning season progresses it is normal to find fewer and fewer eggs/fish, i.e.
smaller and smaller size roe. Scientists do pay attention to the size of the roe and they look
at it in relation to the size of the fish overall. A statistic called “gonadosomatic index” (GSI)
captures this information. In the mackerel stock survey report that I have been referring to,
trends in “GSI” from 1973-1999 are illustrated in Figure 10. This graph deserves a VERY
close look. It shows that in the last two years there has been a drastic departure from the
earlier normal pattern in the GSI. Even worse, it shows a major negative change between
the last two years, 1998 and 1999.
 and including 1984, the condition of mackerel on arrival in the Gulf was above the mean
for 1973 to 1998 (Figure 4), but it fell below that mean between 1985 and 1998, a time
when the Gulf water was cooling down. In 1999, it once again rose above the mean.” For
consistency, the condition factor is calculated at the same time every year, in June. If for
some reason the condition factors for the last two years could be removed from the graph,
it would show a steady declining trend for a couple of decades. And the condition data
from 1998 and 1999 should be removed from this graph for a reason that has already been
described: “feeding and growth began earlier than expected...as early as June...” (All
years except 1998 and 1999 show the condition of mackerel at their annual low point, in
the last two years the “condition” reflects fish that have already started feeding - so, no
comparison can be made.) Therefore a strong argument can be made that feeding
conditions (reflected in “condition factor”) for mackerel in the Northwest Atlantic have in
fact been steadily worsening for at least two decades...which is completely consistent with
the “overall biomass depletion/starvation” theory.
and including 1984, the condition of mackerel on arrival in the Gulf was above the mean
for 1973 to 1998 (Figure 4), but it fell below that mean between 1985 and 1998, a time
when the Gulf water was cooling down. In 1999, it once again rose above the mean.” For
consistency, the condition factor is calculated at the same time every year, in June. If for
some reason the condition factors for the last two years could be removed from the graph,
it would show a steady declining trend for a couple of decades. And the condition data
from 1998 and 1999 should be removed from this graph for a reason that has already been
described: “feeding and growth began earlier than expected...as early as June...” (All
years except 1998 and 1999 show the condition of mackerel at their annual low point, in
the last two years the “condition” reflects fish that have already started feeding - so, no
comparison can be made.) Therefore a strong argument can be made that feeding
conditions (reflected in “condition factor”) for mackerel in the Northwest Atlantic have in
fact been steadily worsening for at least two decades...which is completely consistent with
the “overall biomass depletion/starvation” theory.