THE EFFECTS OF FISHING AND WHALING ACTIVITIES ON THE GLOBAL
CARBON CYCLE....in our ongoing experiment, (pulling everything that we can catch out
of the sea), are we working towards the creation of a human-induced, modern
“Strangelove Ocean”...a sea bereft of life, that exhales CO2?
by Debbie MacKenzie, 2001
(A shorter revised version of this
article was added to this site Oct, 2004)
ABSTRACT:
An increase in atmospheric CO2 is an expected consequence of removal of the marine
biota. It is demonstrated that the progressive fishing-induced biomass depletion of the
world’s ocean is a more plausible explanation for what has triggered the rising CO2 in the
atmosphere, than is our more recent history of burning fossil fuels. The time frame of the effect (rising CO2) fits more closely to the proposed cause (fishing). Proof for the long-term
trend in biomass depletion is found by examining the contrasting pictures of abundant
marine species pre-fishing and the life-depleted status of the world’s ocean today. The
realization that biomass depletion has “bottom-up” effects as well as “top-down” ones leads
to the inevitable conclusion that marine primary productivity is functioning at a significantly
lower level now than it did in the past, when the ocean-atmosphere maintained a steady
carbon balance.
Humans living today cannot remember the great abundance of sea life that existed even 500 years
ago...but the ocean can. Deep water circulation patterns today bring carbon to the surface
in ocean upwelling areas, in the same manner and quantity as they always have. This carbon is “exhaled” to the atmosphere
in a process known as “outgassing.” What comes out of the sea is “very old” carbon, the
memory of marine primary production that took place centuries ago. The deep water
contains a vast pool of carbon, and it circulates only very slowly; the average turnover time
may be about 1000 years. For many thousands of years the ocean and atmosphere
maintained a carbon balance, and atmospheric levels were steady, but no longer. “New”
carbon cycled into the deep water annually balanced the amount that was cycled out...but a rather
long lag time exists between the two. Due to the drop in marine primary productivity,
todays carbon input to the deep water falls significantly short of what is required to balance
the amount that the ocean sends out via “outgassing.” Due to the 1000 year lag time
between the input and output ends of the cycle, readjustment will take a while. The ocean
and atmosphere are seeking a new state of carbon balance. The amount of CO2
exhaled annually by the ocean today represents the average amount of carbon put into the deep pool
on a yearly basis over the last 1000 years. Due to the fishing-induced imbalance, CO2
levels in the atmosphere are rising. For the past two centuries the sea has “exhaled” larger
amounts of CO2 than it has “inhaled.” This is an unrecognized consequence of human
fishing, and continued fishing will only exacerbate the situation.
INTRODUCTION
“Strangelove Ocean,” is a colorful label once used by a serious research scientist (and movie
buff?) to describe the condition of the Earth’s ocean immediately following the mass
extinction of the dinosaurs (the episode that happened 65 million years ago). At that time it
seems that the majority of living things in the sea experienced relatively sudden
death...hence his reference to the effects of the Doomsday machine in the 1960’s SciFi
movie “Dr. Strangelove.” The term “Strangelove ocean” is still used in serious scientific
work because it provides a useful model of the physical functional processes in the sea that
continue in the absence of life, and also the contrasting effects that occur as the result of
the addition of life to the sea (e.g. Shaffer, 1993).
One predictable effect of the removal of a large fraction of marine life is that significant
amounts of CO2 will be released from the sea to the atmosphere via a process known as
“outgassing.” That is what happened following the dinosaur extinction, CO2 levels in the
atmosphere rose to a very high level following that event, and it took millions of years for
the reaccumulation of sea life to draw atmospheric CO2 back down to levels similar to
those that we might enjoy. The recent evolution of large-scale fishing and whaling activities
by terrestrial animals is relentlessly removing the life from the Earth’s ocean, and will have
the same ultimate effect on the sea - a lifeless “desert” will be created, a “Strangelove
ocean,” - and the same atmospheric consequences will ensue. The “experiment” has been
underway for several centuries and is progressing nicely, CO2 levels in the atmosphere
have been rising as predicted, rising ever higher as the sea life forms are increasingly
depleted....the problem is, the humans running the experiment seem to have not the
foggiest idea of what they are doing to the planet.
A DYING SEA WILL PREDICTABLY EXHALE CO2 <==> AND EARTH’S
OCEAN IS DYING!
Recognition of the fact that the amount of life in the sea has been decreasing since we
began fishing, brings us to the admission that the ocean is now slowly “dying,” and it has
been for quite some time. The CO2 exhalations of the depleted sea are not a thing to watch
for in the future, the change has already been demonstrated in records from the recent past.
In recent decades the concentration of CO2 in the Earth’s atmosphere has risen into a
range unprecedented during the last few million years.
Another point, fossil records indicate that there was a significant occurrence of unusual
plankton blooms in the “Strangelove ocean” following the terminal Cretaceous event.
Reassuring ourselves about the abundance of plankton, and that plankton levels look
“normal” is not enough to prove that the ocean is not exhaling more CO2 than it is
inhaling. That critical factor, the amount of CO2 ultimately taken in by the sea’s “biological
pump,” is determined by the whole scope and vibrancy of the entire living marine web.
Implying net CO2 uptake from plankton measurements alone is not possible. Unusual
plankton blooms followed the extinction of the dinosaurs?....unusual plankton blooms are
also increasingly emerging as a feature in our own experimentally altered ocean....is something
“strange” happening at sea?
This author proposes that human fishing and whaling acitivity has resulted in an
increasingly nitrogen-deficient sea, and thereby has caused a progressive slowing of the
“biological carbon pump” and disruption of the pre-fishing balance that characterized the
planetary carbon cycle in recent millenia.
FISHING INDUCED MARINE BIOMASS DEPLETION
VS.
FOSSIL FUEL EMISSIONS
--which is the greater contributor to the rising concentration of atmospheric carbon
dioxide?
Operating on the assumption (a not commonly accepted, but intuitively obvious, one) that
the fishing industry has caused a progressive loss of overall marine biomass, comparing the
time scales of the fishing industry with that of the recently rising CO2 trend, makes an
interesting exercise. This is not to say that fossil fuel emissions are having zero impact on
the atmosphere, it merely points out that the impact of the missing sea life appears to be a
much greater one. The data seem to fit together better.
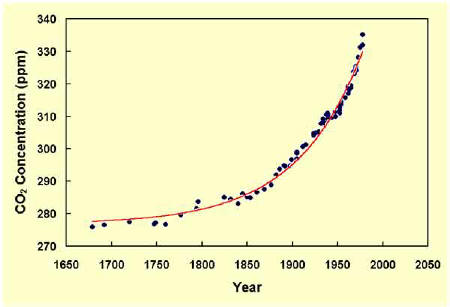
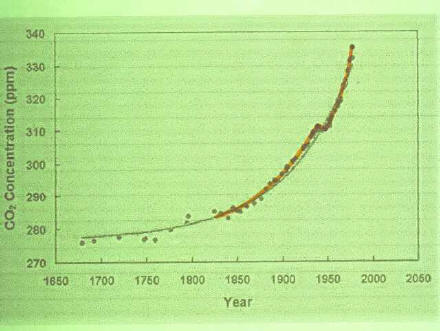
The records of the CO2 rise and the rise in fossil fuel emission, how closely do they
match? It presents a surprisingly poor correlation. Prior to 1800, CO2 levels in the Earth’s
atmosphere had stabilized at approximately 280 ppm for a period of at least 10,000 years.
The current increase began at the turn of the nineteenth century, 60 years before the
beginning of the industrial revolution (1860), in fact a substantial rise was recorded well
before that time.
“INITIAL INCREASES IN CO2 PREDATE THE INDUSTRIAL REVOLUTION.”
This is an important clue, and it is one that has not been overlooked by the researchers. But
it presents a perplexing question because CAUSE clearly must precede EFFECT. So,
there had to be another anthropogenically-induced net source of CO2 to the atmosphere
prior to 1860. In the search for the source of excess CO2 pre-1860, scientists have
concluded that it was the result of land-clearing practices and wood burning at the time.
Therefore, at some point, the official explanation for the rise in atmospheric CO2 changed
from “fossil fuel emissions” to “fossil fuel emissions plus land clearing.”
Land-clearing has obviously continued since 1860, with a shift in the activity from northern
temperate areas to tropical ones in more recent times. The absolute effect of land-clearing
on CO2 levels remains hard to pinpoint however, since areas where trees regrow (new
growth forests) are carbon sinks, as opposed to old growth forests which appeared to exist
in an approximate carbon balance with the atmosphere. Also, human activity may have
supressed the baseline level of forest fires, therefore preventing some release of CO2 from
wood-burning that would have occurred naturally. Another observation has been that some
of our changes in land use, for example the culture of certain crops, results in carbon
fixation at higher rates that the natural undisturbed vegetation would have accomplished.
Terrestrial sources and sinks of carbon have been studied in great detail in recent years, and
it has been increasingly revealed that terrestrial ecosystems, even the human-altered ones
like North America, are surprisingly effective as carbon sinks.
 If the terrestrial system is acting as a net carbon sink now, is it not likely that it also
functioned this way between 1800 and 1860? If so, then we can no longer be certain that
changes in land use that occurred between 1800 and 1860 were of a type and magnitude to
actually cause the recorded CO2 rise during that time. Examination of historical records of
land use is being done now to try and answer this question...but it is unlikely to reveal
anything that definitively points to changing land-use practices as the net CO2 source early
in the nineteenth century. If not, then another CO2 source must be implicated,
something ELSE was happening between 1800 and 1860 that was causing CO2 to rise
in the global atmosphere.
If the terrestrial system is acting as a net carbon sink now, is it not likely that it also
functioned this way between 1800 and 1860? If so, then we can no longer be certain that
changes in land use that occurred between 1800 and 1860 were of a type and magnitude to
actually cause the recorded CO2 rise during that time. Examination of historical records of
land use is being done now to try and answer this question...but it is unlikely to reveal
anything that definitively points to changing land-use practices as the net CO2 source early
in the nineteenth century. If not, then another CO2 source must be implicated,
something ELSE was happening between 1800 and 1860 that was causing CO2 to rise
in the global atmosphere.
Commercial fishing* is one human activity that flourished between 1800 and 1860, and
our understanding of the workings of natural systems now allows us to realize that this
extraction of sea life had the potential to cause a rising trend in atmospheric CO2. (* The
meaning of “fishing” in this discussion is all sea life extraction, besides catching fish it
includes whaling, sealing and the killing of seabirds.)
The simplest explanation for how this could occur starts with the observation that the sea
only makes “new” fish protein very slowly (via N-fixation). The vast majority of all living
things in the sea are constructed of recycled parts - the scarcest piece being the “fixed
nitrogen” that is needed for the construction of every molecule of protein. All living things
are involved in the recycling game, from the biggest to the smallest, and all are therefore
interdependent. Removing too many living things simply removes too many of the essential
building blocks (especially N), and less in total is left for recycling. Therefore, prolonged
relentless fishing has the potential to deplete sea life at all levels, not just at the level of the
target species or its immediate predator.
But how would the existence of less sea life result in more CO2 being released to the
atmosphere?
The declining abundance of sea life causes a proportional decline in the strength of the
“biological pump” which describes one effect of their life processes; the growth of sea creatures as a
group has the effect of actively drawing CO2 from the atmosphere into the ocean, and
ultimately depositing it in solution in the vast resevoir in the ocean depths. (Both the
“organic pump” and the “carbonate pump” will be negatively affected by biomass removal
since the carbonate pump also depends on the existence of living shell-forming
organisms.)
There is another force affecting CO2 exchange between the ocean and the atmosphere.
Called the “solubility pump” it describes the physical process whereby a gas in solution
moves to reach equilibrium with its concentration in the air above. If CO2 is higher in the
atmosphere than it is in the water, some will diffuse into the water until the concentrations
are the same. Movement in the opposite direction also occurs, when CO2 levels in the
seawater exceed those in the air, CO2 diffuses out of the ocean in the process known as
“outgassing.” “Outgassing” of CO2 happens most intensely in areas of the ocean where
there is the strongest upwelling tendency of deep CO2 rich water. This is driven by
physical processes which are essentially stable, the spinning of the globe and the
temperature difference between the poles and the equator. If we choose to think of the
ocean as a living thing, this “outgassing” represents “exhalation” of carbon dioxide into the
atmosphere.
A long-established ocean ecosystem, like an “old growth forest,” will reach a point of
equilibrium where the amount of CO2 “inhaled” by the living organisms will be
approximately equal to the amount that is “exhaled” on an annual basis. That appears to
have been the state of the world’s ocean before human fishing became well established.
The imbalance occurred because fishing caused a reduction in the amount of CO2
“inhaled” by the biological processes, which was not reflected in a reduction in the amount
of CO2 “exhaled” by the physical processes. We pulled most of the fish out of the sea but
the world is still spinning and the sun is still shining, so CO2 net outgassing will continue
until a new state of equilibrium is reached. “Exhalation” of CO2 will continue long after
“inhalation” stops because of the very slow turnover time of the vast resevoir of deep ocean
water. This deep, CO2 (actually carbonate) rich ocean water contains far more carbon than
the world’s flora, fauna and atmosphere combined...and it has been estimated that the
average residence time of carbon that sinks into this pool is 500 to 1000 years.
 Therefore the amount of CO2 that the ocean exhales annually is approximately equal
to the average amount inhaled by the biological pump over the last 500 - 1000 years!
Today’s marine biota is a mere shadow of what existed in the sea 500 - 1000 years
ago, and the strength of the “biological pump” has been reduced accordingly, but ocean currents have not...
therefore it is most likely that the amount of CO2 exhaled by the sea has been
surpassing the amount inhaled for the past two centuries!
Therefore the amount of CO2 that the ocean exhales annually is approximately equal
to the average amount inhaled by the biological pump over the last 500 - 1000 years!
Today’s marine biota is a mere shadow of what existed in the sea 500 - 1000 years
ago, and the strength of the “biological pump” has been reduced accordingly, but ocean currents have not...
therefore it is most likely that the amount of CO2 exhaled by the sea has been
surpassing the amount inhaled for the past two centuries!
How well does the data fit the theory?
First of all, whatever human activity was great enough to have had a measurable effect on
global atmospheric CO2 levels, was something that was very well established before 1800.
It would take a while for the global system to be pushed off-balance, since many buffering
components seem to be built into living systems that tend to maintain more or less constant
conditions. So, whatever it was, it had gathered enough strength to overcome the built-in
stabilizing features of the global system by the year 1800, since that is when the balance
actually started to tip. Fishing was well established and advanced before 1800. Many
populations of marine creatures had been severely depleted, a few to extinction, before that
date. Just to name a few, there were the great auk, the walrus, Steller's sea cow, the Atlantic gray whale and
the other great whales. The slaughter of sea life was well advanced, and even then, at the
beginning of the nineteenth century, fishermen were voicing concerns about the declining
numbers of fish in the sea.
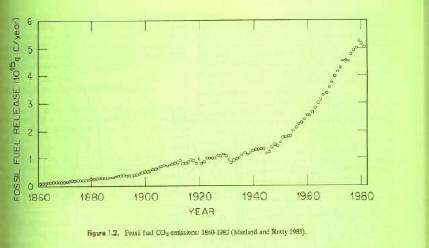
The record of the expansion of the fishing industry is therefore better timed to the record
of the CO2 rise, than is the industrial revolution and subsequent fossil fuel burning
patterns. I have described our extraction of sea life as being “relentless,” but while puzzling
over the detailsof the CO2 record, I realized that for a short period of time during this
“experiment,” humans did relent, and release the fishing pressure to a significant degree. There is an
unexpected “glitch” in the CO2 record for the 20th century, a hesitation in the steady
steeply rising curve...even a tiny downturn was recorded. The timing of this unexpected
change in the pattern coincides with World War II, a time of increased fossil fuel
emissions....but also a time of remarkably less fishing* activity. Fishing, whaling and
sealing in the North Atlantic virtually came to a halt during the war. (Was the “biological
pump” in the sea therefore able to recoup a bit of its former strength while the fishermen
were otherwise engaged, fighting the war?)
“Between 1935 and 1945 the atmospheric CO2 concentration was constant, or even
declined slightly. The reason for this is unknown.” (Gray, 1999)
 Marine life did visibly respond to the release of fishing pressure during the war.
References have been made to the significant increases in fish and seal stocks in the North
Sea and elsewhere in the North Atlantic by the end of the war. The biological activity that
led to the building of those larger fish stocks is the same activity that briefly drew down
more CO2 from the atmosphere, and caused the “glitch” in the graph. There was enough
life remaining in the sea in 1940 so that it was able to rally and realize a noticeable gain in a
few years. Like a “new growth forest,” growing back what was cut down, a fish
community recovering from a depleted state would act as a particularly good carbon sink.
During the wartime break from fishing, marine life in the Atlantic Ocean “inhaled” CO2
deeply, rapidly rebuilding fish stocks, and it seems from the record that CO2 uptake briefly
equalled CO2 exhaled by the ocean in those years.
(Things are different now though, 56 fishing years later the ocean is in a much weaker
condition. We have tried easing fishing pressure on individual stocks only to find that they
are extremely slow to “recover” -- to allow the ocean dwellers to realize a gain we need to
relieve ALL fishing* pressure, not just shift it from one species to another. A hard “pill for
us to swallow?” Yes, maybe, but the alternative will surely be worse.)
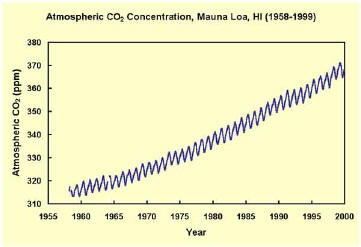 Since 1958 monitoring of current atmospheric CO2 concentrations has been done and
recorded from a network of sites. The record from Mauna Loa, Hawaii, offers the longest
continuous data set, and a good chance to examine the rising trend in closer detail. The
annual sawtooth pattern that is superimposed on the overall rising trend indicates how
immediately sensitive the atmospheric CO2 level is to biological activity on earth.
Atmospheric CO2 responds to changes very promptly. The annual highs correspond with
the spring blooms of terrestrial and marine vegetation in the temperate zones, and the lows
correspond to the winter and the season of dieback and decay. It has also been noted that
the CO2 level responds to certain fluctuations in climate conditions such as ESNO (El
Nino Southern Oscillation). The CO2 response to ENSO events is a significant slackening
of the rising rate. During the unusually strong ENSO event of 1982 the average CO2 level
actually showed a very slight drop. There is no reason to believe that fossil fuel combustion
dropped significantly that year.
Since 1958 monitoring of current atmospheric CO2 concentrations has been done and
recorded from a network of sites. The record from Mauna Loa, Hawaii, offers the longest
continuous data set, and a good chance to examine the rising trend in closer detail. The
annual sawtooth pattern that is superimposed on the overall rising trend indicates how
immediately sensitive the atmospheric CO2 level is to biological activity on earth.
Atmospheric CO2 responds to changes very promptly. The annual highs correspond with
the spring blooms of terrestrial and marine vegetation in the temperate zones, and the lows
correspond to the winter and the season of dieback and decay. It has also been noted that
the CO2 level responds to certain fluctuations in climate conditions such as ESNO (El
Nino Southern Oscillation). The CO2 response to ENSO events is a significant slackening
of the rising rate. During the unusually strong ENSO event of 1982 the average CO2 level
actually showed a very slight drop. There is no reason to believe that fossil fuel combustion
dropped significantly that year.
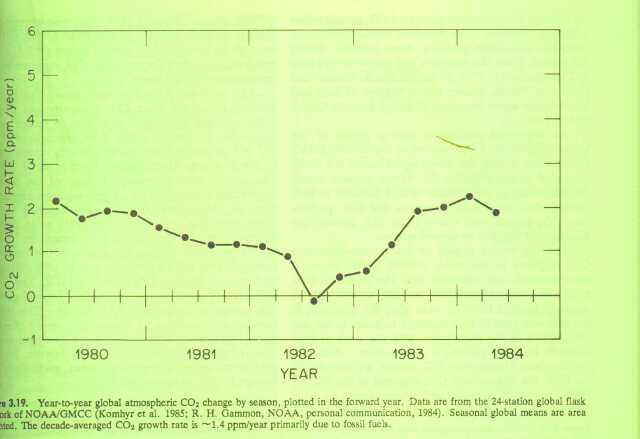
Fossil fuel consumption does not respond reliably to ENSO events but ocean circulation
does, as does the atmospheric CO2 level. A concern to fishery managers and fishermen,
ENSO events cause a marked decrease in the usual pattern of deep-water upwelling. This
results in less biological productivity due to a lowered supply of recycled nutrients from the
bottom, but, more importantly, it also results in a significant decrease in the amount of
deep-water carbon that is released to the atmosphere via outgassing. Therefore, ENSO
events are reflected as depressions in the CO2 rising rate. Conversely, the opposite climate
phenomenon to El Nino, often called La Nina, is associated with an increase in deep-water
upwelling and also higher elevations in the rising CO2 rate. This pattern, of acute atmospheric
sensitivity and response to the strength of ocean upwelling currents, is one indication of the predominant
importance of the ocean in controlling the overall CO2 concentration in the atmosphere. (The graph shows the global CO2 rising rate dipping just below zero in the fall of 1982 - that was NOT a period of time during which we'd stopped burning fossil fuels. The dip is clearly related to the temporary slacking of the oceanic upwelling currents and their substantial contribution of CO2 to the atmosphere.)
Another detail that has been commented on is the fact that the overall rising rate of CO2
has slackened slightly in the last decade or so. Not closely in step with patterns of fossil fuel
combustion, yet this does parallel the recent levelling off of total wild fish harvests from the
world’s ocean. Annual capture fishery yield rates are increasing no longer...is this what the slowing
of the rising CO2 rate reflects?
Another interesting detail is the fact that atmospheric CO2 rates are higher over parts of the
ocean than they are over land.
“I do make the point, however, that all the stations are in remote sites, far from
industrial or agricultural perturbation. Also the measurements are deliberately biased.
The New Zealand results, for example, are only registered when the wind comes from the
sea. The figure from the land is lower, but they do not want to know.” (Gray, 1999)
The contrast between CO2 levels over land areas and sea areas has not typically been well
described, the literature focusing instead on “well mixed background levels” obtained at
“remote” sites. Recently, however, a closer look has been taken at the distribution pattern
of CO2 in the atmosphere. According to a study done at NOAA’s Climate Monitoring and
Diagnostics Laboratory (CMDL):
“The North American land surface appears to be absorbing possibly as much as between
1 and 2 billion tons of carbon annually, or a sizeable fraction of global emissions of
carbon dioxide from fossil-fuel burning.”
The research team obtained its data from 63 atmospheric sampling stations of the
GLOBALVIEW database. GLOBALVIEW-CO2 is a compilation of high-quality
atmospheric measurements of gases made by different laboratories, and is a product of
the Cooperative Atmospheric Data Integration Project, coordinated by NOAA-CMDL.
The researchers developed a three-dimensional grid of Earth to model the flow of carbon
dioxide, and applied the GLOBALVIEW data to it. They expected to see the amount of
atmospheric CO2 increase over North America, caused by the gas produced by the
burning of fossil fuels. Instead, the model showed that for the period of time studied,
carbon dioxide declined in the atmosphere across North America as the model’s winds
moved from west to east. The decline of atmospheric CO2 indicates that the gas is
being absorbed into the land mass.
The scientists are not sure what is causing the decline of carbon dioxide. They theorize
that it is partly due to the regrowth of plants and vegetation on abandoned farmland and
previously logged forests in North America. It may even be enhanced by human-induced
nitrogen deposition, a diluted form of acid rain. Although the actual cause is unknown at
the moment, the researchers believe that plants and soils are a major factor in CO2
absorption and will continue to exert considerable influence on atmospheric carbon
dioxide in the future.
Pieter Tans emphasizes that even when researchers can account for most of the carbon
dioxide that has been emitted globally, the future remains uncertain. “The current uptake
of carbon by terrestrial ecosystems is helping to slow down the rise of CO2 in the
atmosphere, but we need to know why this is happening,” he says. “Only then may we be
able to project for how long into the future this process may continue.”
“This finding will assist us in better understanding the global fate of carbon dioxide,”
Tans says. Jerry Mahlman, director of NOAA’s Geophysical Fluid Dynamics Laboratory
and a co- author of the Oct. 16 paper, says that the North American sink may prove
important in worldwide management of atmospheric carbon absorption. Its value, he
adds, will be at a global, rather than a regional level." (reported online at
http://inet2.agiweb.org/agi/geotimes/dec98/newsnotes.html )
The extent to which terrestrial systems are acting as carbon sinks is just beginning to be
appreciated. The amplitude of the annual fluctuation in CO2 is rising, presenting another
piece of the puzzle. It seems that much terrestrial vegetation is growing more vigorously
than it did previously, reacting to the increased availability of CO2 in the air (the “CO2
fertilization effect”), slight temperature increases and longer growing seasons in temperate
zones. This tendency seems to be one of the built in stabilizing mechanisms in the elaborate
set-up of natural life as it developed on the planet, the accelerated plant growth (increased
CO2 uptake) represents an attempt to correct the rising CO2 in the atmosphere. The
formation of soil carbon deposits would similarly occur at an increased rate. Will our
understanding of the uptake capacity and current functioning of the terrestrial sysem
someday expand to the point that we are no longer searching for a “missing sink” but for a
“missing source?”
A question that must arise from NOAA’s study is this one:
“Why does the air blowing from the west, from over the great Pacific ocean, contain
a higher concentration of CO2 than the same air mass after it has passed over the
human-developed terrestrial system in North America?”
How much CO2 “outgassing” from the ocean is occurring? This factor seems to be
treated as a constant in the climate models, it is assumed to be balanced by the (also
assumed to be constant) carbon uptake of the marine “biological pump.” There seems to be
no index of suspicion around how steadily the carbon balance in the ocean system has been
maintained over recent centuries. Lately questions have arisen about the effects that
changing temperatures and atmospheric CO2 concentrations might have on the biological
and physical function of the ocean in the future. But there has been no real investigation
into the extent to which the sea and it’s carbon pumping balancing act, have already been
altered by human activities in the recent past. It seems to be taken for granted that marine
“primary productivity” has been unchanged by the great extraction of sea life that we have
accomplished over centuries. This simply cannot be true.
The CO2 concentration in surface seawater is expected to increase in response to the rising
level in the atmosphere. The normal gas diffusion process would predictably cause this to
happen. Although the data is sketchy, one example comparing the rising CO2 in part of the
ocean with that in the atmosphere was included in the US Dept of Energy report from
1985 “Atmospheric Carbon Dioxide and the Global Carbon Cycle.” The example concerns
the Sargasso Sea, a normally highly productive area of the ocean that would be expected to
perform as a net carbon sink. The levels recorded in the surface waters of the Sargasso Sea
are therefore lower than the atmospheric average, as would be expected. From the text: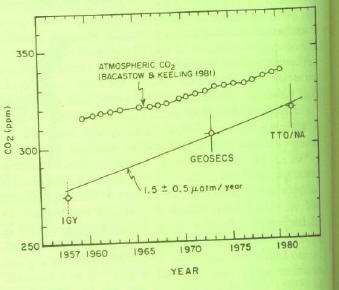
“Of great interest is the appearance of excess carbon in the upper ocean resulting from
increasing atmospheric CO2 concentration. Takahashi et al. (1983) observed a
long-term increase in pCO2 in Sargasso Sea surface waters, based on direct
measurements during the successive International Geophysical Year (IGY, 1957),
Geochemical Ocean Sections (GEOSECS in 1972), and Transient Tracers in the Oceans
(TTO in 1981) surveys. Although the best straight-line fit to the data does not exactly
parallel the atmospheric increase during the same period, the agreement is satisfactory,
considering the uncertainties in the measurements and possible changes other than the
uptake of CO2 that could alter pCO2 in these waters during the 24-year period.” (US
DOE/ER-0239, December 1985)
Of course there is a lot of uncertainty about what can be inferred from sketchy data like
this. Interpretation can be all in where your suspicions lie, however. It’s very often true that
“you will find what you look for.” Since the slope of the rising CO2 trend in the seawater
over the time period is not only “not exactly parallel,” but is visibly steeper than the one for
the atmosphere...if one suspected that the ocean was “leading the dance,” one might
construe this as being supporting evidence for that particular theory. (CO2 levels rising in
the ocean first, diffusion resulting in a rise in the atmospheric level, which is dampened
however by the compensatory response of terrestrial vegetation, hence a rising trend in the
air results that is less steep than the one occurring in the sea.)
“Oh Where Oh Where Does the CO2 Go?” (NASA, 2001)
Researchers are expecting the ocean to absorb more CO2 by diffusion that it has in the
recent past, due to the fact that the level in the air is rising. Efforts to find actual evidence
of this (an increased rate of carbon entering the deep water resevoir) have so far been
unsuccessful. This is presumed to be because the “signal” is still to small to detect...not
because it may not be there.
“The ocean plays an important role in the climate system by regulating the amount of
CO2 in the atmosphere. Carbon dioxide entering the deep waters is removed from
interaction with the atmosphere for periods of hundreds of years. A significant fraction of
the excess crbon dioxide released by man’s activities enters the deep waters of the ocean
and plays no further part in global warming over century timescales.” (Ocean Carbon
Cycle Modelling Group)
A few comments from ocean modelling researchers reveal the lack of suspicion regarding
marine biomass depletion (and resulting N-shortage), but also the sure knowledge of what
would be the atmospheric result IF such a thing should happen in the ocean.
“Marine biology does, however, not sequester anthropogenic carbon, because -
according to current knowledge - biological production in the ocean is not influenced by
changes in pCO2, but is controlled by other factors like light, nutrients (notably N & P)
and grazing by zooplankton. Therefore, marine biology is often omitted from the models
designed for simulating the oceanic CO2 uptake. Carbon cycle modellers have always
used the assumption that the natural transfers of carbon were in a steady state before
industrialization began and that this is still the case.” (Siegenthaler, 1993)
“If the marine biota were removed, the atmospheric pCO2 would increase from its
present value of 335 ppmv to 465 ppmv.” (Fasham, 1993)
“Large changes in ocean inventories of inorganic N over (short) time scales may lead to
climate change via changes in new production and in atmospheric pCO2....whereas
nutrient availability controls levels of new production over most of the ocean...A change
in ocean-atmosphere setup would cause the system to drift to a new steady-state with a
different baseline pCO2. During readjustment there would exist a net flux of CO2
to/from the ocean. The ocean contains more than 98% of the global resevoir of mobile
carbon...Thus changes in the physical and/or biological setup of the ocean were probably
the main causes for observed glacial-interglacial changes in the chemical composition of
the atmosphere...It is changes in total nutrients in the ocean (nutrient inventories) or
changes in the efficiency with which marine production uses available nutrients (Redfield
ratios, new production at high latitudes) that have the largest relative effect on
atmospheric CO2 levels via the action of the marine biosphere.” and, regarding his
ocean modelling work, “the assumption being that the deep interior is as yet relatively
unaffected by the anthropogenic perturbations.”(Shaffer, 1993)
...The deep interior is
indeed relatively unaffected, that is why it continues to exhale the large amounts of CO2
that were routinely given off pre-fishing while the ocean slowly adjusts, trying to “drift to
a new steady state,” one with a markedly reduced rate of biological production.
It is frequently asserted that the ocean is the ultimate carbon sink for anthropogenic carbon
emissions. And a lot of energy is being put into the study of exactly how and over what
time frame this atmospheric adjustment will be made. We are looking to the ocean to solve
what we believe to be a terrestrial-source problem...but it is possible that we’ve taken hold
of the wrong end of the stick? Could the rising CO2 be an ocean-source problem in the
first place, with a partial correction being achieved by the terrestrial system? Could our
attempts to solve the puzzle by framing the question backwards be the ultimate source of
our frustration with this problem?
THE LEVEL OF CO2 IN THE EARTH’S ATMOSPHERE
-- WHAT’S PLANKTON GOT TO DO WITH IT?
The claim that fishing may have caused the rise in global CO2 levels is plausible if
two related points can be proven:
(1) The first is that significant depletion of the overall marine biomass has occurred as a
result of fishing.
(2) The second is that a feature of this biomass depletion has been that the entire marine
food web has been negatively affected, including the phytoplankton, the organisms
responsible for the actual extraction of CO2 from the atmosphere.
(1) Has the sum total of life in the sea, the overall marine biomass, been lowered by
fishing?
YES, MOST DEFINITELY.
Prevailing beliefs in marine biology have largely prevented appreciation of this fact, but it’s
a blatant truth that is staring us in the face. A few short centuries ago we started with
this sort of fish stock assessment:
“It is probably impossible for anyone now alive to comprehend the magnitude of fish life
in the waters of the New World when the European invasion began. It may have been
almost equally difficult for the early voyagers. According to the record they have left for
us, they seem to have been overwhelmed by the glut of fishes.
In 1497, John Cabot set the tone by describing the Grand Banks as so ‘swarming with
fish [that they] could be taken not only with a net but in baskets let down [and weighted]
with a stone.’ On the lower St. Lawrence in 1535 Jacques Cartier reported that ‘This
river...is the richest in every kind of fish that anyone remembers ever having seen or
heard of; for from its mouth to its head you will find in their season the majority of the
varieties of salt- and fresh-water fish...great numbers of mackerel, mullet, sea bass,
tunnies, large eels...quantities of lampreys and salmon...[in the uper River] are many
pike, trout, carp, bream and other fresh-water fish.’” (Mowat, 1984)
So, people arriving on the eastern coast of North America 500 years ago were
“overwhelmed by the glut of fishes.” And now...after a few centuries of plying our fishing
industries, we are left with this sort of assessment (recent comments from a respected
marine biologist on the changes that he has witmessed in the span of his career):
“Essentially, if we compare the amount of fish, the biomass of fish before the introduction
of industrial fishing in various parts of the world, what is left, the relationship is about 1
to 10 roughly; that is you go into the Gulf of Thailand, you catch if you’re 20 kilograms
per hour with a standard trawl. Then in the 60s you would catch 200, 300 kilogram per
hour with a standard trawl so you have a fact of 10. And this fact of 10, that’s what you
find in a lot of fisheries...For things like seabirds and sea turtles and large marine
mammals, we probably have much less than 10%, perhaps 1%, perhaps even less.
Turtles, it’s a disaster. Some species of marine mammals are extinct.” (Daniel Pauly,
1998)
Comparing these two perspectives provides rather impressive circumstantial evidence of
overall depletion of sea life.
The assertion that the overall marine biomass has been reduced is commonly countered
with the argument “YOU CANNOT PROVE THAT.” This resistance is largely because
of the prevailing belief that marine biomass is not disappearing as such, it’s just shifting
from one species to another, from things that we like to eat to things that we are not so
interested in eating. Called “species replacement theory,” this has never actually been
proven to occur either. But one thing that “species replacement theory” and many
biologists predict is that marine life is, or will be, shifting towards a lower species mix
(equalling the same total biomass) that will include an unusually high amount of plankton.
“Plankton soup” it has been called.
It is a well recognized fact that plankton are key players in ocean productivity. This refers
to phytoplankton in particular, since they are the tiny plants that draw CO2 from the
atmosphere, build organic molecules, and harness energy from the sun. Phytoplankton
effectively nourish all life in the sea. They are the carbon-fixers, the “primary producers,”
how much work they get done ultimately determines the size and scope of the food web
that is supported in the ocean.
The marine food web as a whole is looking rather shaky these days (fish stocks “crashing”
here and there)...how well are the phytoplankton holding up? Have they increased their
numbers to “replace” the legions of missing fish?
Is primary production in the ocean (net carbon fixation) occurring at a consistent rate? Is
the marine biota absorbing as much CO2 as it used to? Has this critical process in the sea
remained unaffected by fishing? (...The best scientific answer to the last question can be
summed up as “We don’t know but we hope so.”)
Marine primary production - the work of fixing carbon - exactly how much is getting
done? The actual quantitative measurement of the net primary production accomplished by
marine phytoplankton in the ocean is a formidable and complicated task. So many
changing variables are involved simultaneously; light, temperature, salinity, nutrient
availability, the actual species mix of the phytoplankton community, and the zooplankton
grazing pressure...just to name a few. And none of these variables is a constant. Each exists
along overlapping gradients which are in constant flux on many levels...and they are all
intertwined, the variables interacting with one another, adding ever more layers to the
complexity of the problem. If one variable changes, many others shift as well in response.
It becomes impossibly complicated from a mathematical modelling point of view. In the
unlikely event that all the factors and their relative weights could ever be included in a
mathematical model to accurately determine the net primary productivity in one cubic mile
of seawater today...that would still be all that we would know. We would remain ignorant
of the true extent of primary production in the vast majority of the sea, and more
importantly, of the level of productivity that existed in the past.
This is a summary of what we know at this point about “net primary productivity” in the
ocean:
-- There are no accurate current estimates or models.
-- There are no old scientific records for comparison, the numbers do not exist.
-- We are just starting to figure out the basics of how it works.
There are a few relevant records, however, not direct measurments of phytoplankton
productivity, but rather of the abundance of their first-level consumers, the zooplankton.
There are a few data sets on zooplankton abundance that span several decades. And
contrary to the expectation of a developing sea full of plankton, the animal-plankton group
appears to have been recently suffering a decline.
-- A study of zooplankton abundance off California recorded a 70% drop over recent
decades.
-- Off the Northwest Atlantic coast, zooplankton have also been recorded to be
declining over decades (essentially for the duration of the data set).
The records from the Canadian Department of Fisheries and Oceans show zooplankton to
currently be at unusually low levels...but it appears that phytoplankton is simultaneously at
higher than usual levels. And the “greeness” is increasing. “Greeness,” an indicator of
“chlorophyll a” content is also monitored by satellite images these days. “Greeness” seems
to be fairly high, so the implied hope is that therefore primary productivity is also
comparatively high. But this may be too much to hope for.
“Greeness” is a measure of chlorophyll a content of the seawater -- but the truth is that
nothing more can be concluded from the data besides just that..."the chlorophyll a content
of the seawater." It can hardly be expected to translate simply into a proxy for net primary
productivity. We have had a glimpse at the complexity involved. Just one relevant
observation is that phytoplankton productivity is part of a moving picture, while the little
plants are growing, they’re simultaneously being grazed down by the little animals. Take
away the little animals and it’s likely that the grass will grow higher. So phytoplankton must
be assessed in the context of how many co-existing zooplankton are in the picture (at the
very least). The Northwest Atlantic picture, among others, has significantly less
zooplankton in it today. So grazing pressure has been partially released, allowing an
increase in the phytoplankton standing stock? Maybe, maybe not, the standing stock may
not necessarily be any higher (since chlorophyll content can vary considerably), the certain
thing is only that the “greeness” is higher. Light is an important limiting factor in the
formation of chlorophyll...the missing zooplankton would leave the water a bit clearer, and
better light penetration could be taken advantage of by the algae, the chlorophyll a makers.
Maybe a slightly increased availability of light allows the efficiency of nutrient use by
phytoplankton to increase? One thing is sure...the removal of both the grazing effect and
the shading effect of zooplankton add a few more wrinkles to the phytoplankton
productivity assessment problem.
Besides at sea sampling, there is a great, modern program in place wherein satellites
monitor the worldwide “greeness” of ocean water. But scientists know that the usefulness
of the information is extremely limited. A scientific assessment of the usefulness of the
greeness index in determining how much CO2 is being removed from the atmosphere:
“P vs E (Photosynthesis/Irradiance) parameters and bio-optical parameters are
conveiently normalized to Chlorophyll a. This has been and still is the only pigment
routinely measured at sea, using simple techniques...the amount of Chlorophyll a is
generally used as an index of the living, photosynthetically active phytoplankton biomass.
Because of the up to tenfold variation in the carbon to chlorophyll ratio in natural
phytoplankton communities, chlorophyll a data should not be used without qualification
for estimating algal carbon. Direct measurement of algal carbon in nature is impossible
in most cases because it is inseperable from non-algal carbon by any convenient and
reliable approach.” (Sakshaug et al. JGOFS 1998, Parameters of Photosynthesis:
Definitions, Theory and Interpretation of Results.)
Therefore measurements of chlorophyll a content or “greeness” indices cannot tell the tale
about how actively or efficiently “marine primary productivity” is functioning. It does not
indicate carbon flow. These studies will never provide “the number,” the tonnage of carbon
dioxide removed from the atmosphere annually by marine phytoplankton.
What is the best way to approach a puzzle like this one Is primary productivity in the
ocean increasing, decreasing or has it remained stable?
Scientists often use “proxy” records to learn information from the past. Sometimes it’s as
good as they can get. For example, inferences are made about such things as past climate
conditions by studying growth rings in trees. It is considered a valid scientific approach to
investigation.
Humans are not the only ones who keep records. The long-lived consumers of plankton
sometimes also keep them. For example, the bowhead whale in the Bering Sea has recently
been discovered to have been keeping decades long records of marine primary productivity
in the growth pattern of its baleen. According to the lead researcher, Donald Schell:
"We've actually looked at bowhead whales to learn how ocean productivity has changed
over the past 50 years. It turns out that whales are a unique window into the past.
Bowhead whales overwinter in the Bering Sea, where they feed on zooplankton.
Zooplankton are the first consumers of phytoplankton, the small plants that are the first
rung of the ocean food chain and an important indicator of productivity in the ocean.
These whales consume vast amounts of zooplankton. And also because they eat the
zooplankton in the fall of the year, the zooplankton have themselves consumed and stored
the energy of a large percentage of the ocean's phytoplankton productivity. This
productivity can be measured by using isotope ratios in the baleen of whales. Without
getting too scientific, I measured the type of carbon in whale baleen. Since you are what
you eat, the carbon in this case is from the consumption of plankton. The changes in
carbon type in whale baleen reflects the abundance of plankton in any given year and can
be used as an index to changes in ocean primary productivity.
If you isolate the portion of the baleen that reflects plankton eaten in the Bering Sea, you
can see the changes that occur over time. We've studied baleen taken from recently
harvested whales and from whales harvested in the 1960s and the 1970s. And by using
the animals from the 1960s we can look all the way back to 1946. From this we have
developed a record of phytoplankon productivity in the Bering Sea all the way back to
1946. The story it tells is amazing because the whale baleen reflects phytoplankton
productivity quite well. The record shows that from 1946 to 1963 everything went along
fairly smoothly at a relatively high rate of productivity. And then in the mid-1960s it
increased and peaked at around 1965. Then ocean plankton productivity began to
decline, and since the mid-1970s it has gone down and down and down. The last samples
we have from 1994, 1995 and 1996 show the lowest primary productivity in the Bering
Sea over this 50-year period.
The implication is that the Bering Sea has decreased in productivity by 35 to 40 percent
since its peak in 1965 or so. Now a 40 percent decline in the carrying capacity of the
ecosystem is going to have profound effects on the top consumers, and I think that is in
part what we are seeing now. Salmon are near the top of the consumer chain. Steller sea
lions are at the top and they eat salmon and other fish. It implies that there is indeed a
bottom-up change that is occurring, and it may have contributed to the decline of these
mammals and other Bering Sea species." (Schell, 1998)
A large decrease in ocean productivity? ....having “profound effects” on
top consumers? (and obviously also on some “lower” ones as well, since
the bowhead whale doesn’t qualify as a “top consumer”)....why would
this change NOT be expected to similarly have a “profound effect” on
the ocean-atmospheric CO2 balance?
Regarding the implications of this study, the conclusion reached about the Bering Sea
reaching a productivity “peak” in 1965 may not be valid. In an environment containing
more food supplies than are needed, organisms like whales will obtain optimal nutritional
stores and then presumably will stop feeding. If there is twice as much food as they need,
they are not likely to grow twice as big, but are more likely to simply spend less of their
time foraging for food. If they should grow too fat, that in itself would become a
disadvantage. Therefore, a safer conclusion to draw may be that, starting in 1965, bowhead
whales in the Bering Sea began to experience less than optimal nutrition, and the
downward trend since that time has been continuous, and is currently at an all time low.
(Maybe they’ve crossed a threshold where the energy expended by a large whale foraging
is more than it’s worth feeding in today’s watered-down “plankton soup.” Maybe that’s
why this whale is on the endangered species list....is the bowhead suffering from borderline
starvation? One thing is certain about the bowhead: the whale’s assessment of net primary
production in the sea takes into account all of the complex mathematical variables that
today’s scientists are still struggling with.)
Another note on the recent decrease in productivity in the Bering Sea -- the downturn there
is commonly attributed to changes in ocean currents and nutrient mixing patterns. Less
nutrients from the bottom are therefore being brought to the top for recycling, hence mass
starvation in marine life. But the picture is larger than the Bering Sea. The same pattern of
declining productivity can be seen elsewhere, in areas of the ocean that are constantly,
reliably, top-to-bottom mixed by tidal action. Examples are off the east coast of North
America, where the Bay of Fundy and Georges Bank, formerly rich and productive fishing
grounds, are demonstrating the exact same patterns. Consistent mixing...yet declining
marine life...
Reflections of the rate of primary productivity in the ocean go well beyond whales, living
“proxies” for NPP in the sea are yet fairly widespread. THEY ARE THE FISH! And the
fish are increasingly getting less food to eat as well. There is ample scientific data to
support this contention, as has been argued in detail elsewhere on this website. The marine nutrient cycle
has been interrupted, nitrogen loss to fishing has never been appropriately
replaced by humans, who have now run up a huge protein/nitrogen debt. (Note: sewage is
useless as fish food. Thinking that the nutrients we're dumping into the sea via polluted runoff would nourish the fish stocks, was a vain hope. The information contained in the living fish reveals the truth about the state of marine primary production, about how well they are faring in today's supposedly "overnourished" ocean.) A selection of relevant points:
-- declining abundance and stunted growth are occurring simultaneously in multiple fish
stocks. Weight-at-age and condition factor are in general decline for fishes, the trend being
more pronounced for the larger ones.
-- Size-at-maturity and age-at-maturity are also dropping in seemingly all sea life. It appears
to be a response to the gradual closing of the window of opportunity.
-- The “top end” of the marine food web is the most severely impacted, larger species and
larger fish are disappearing first. But they are not the only ones feeling the pinch. Just
being bigger entails more risk today. An example from the whales: the enormous blue
whale and the much smaller minke whale share the same diet of krill. Significant, although
declining, numbers of minke whales still exist while the blue whale is already near
extinction.
-- Unusually high numbers of gray whales are dying of starvation in the Pacific Ocean.
-- The bowhead whale’s cousin, the Northern right whale is in worse shape in the
Northwest Atlantic. It is more severely endangered. This similarly styled
plankton-dependent whale ventures farther south than the bowhead, therefore necessarily
enduring a fasting period on its trip to the tropical calving grounds. Reproduction in right
whales has been reduced to a very low level, and scientists have observed a significant
number of “emaciated” right whales in recent years (there is no real need to check the
baleen record there, these whales are simply not getting enough food).
-- Fisheries production is dropping worldwide.
-- The blubber thickness of the minke whales killed by the Japanese “researchers” has
shown a steady declining trend since the beginning of their “study.”
-- The abundance of Antarctic krill has been declining (while efforts are made to relate this
to changes in the extent of ice cover and ultraviolet radiation...it still fits perfectly well into
the worldwide pattern of decline. The worldwide drop in zooplankton cannot be related to
increased UV radiation, because that has only occurred at the planetary poles up until this
point. On the other hand, fishing has been done “everywhere.”)
-- A resident dolphin population in the U.K. is threatened by starvation. (This is recognized
and blamed on fishermen who have been catching the dolphins’ normal prey...but the
pattern is more insidious than that, plankton eaters in the sea are starving too - fishermen
didn’t directly take their prey, but their actions have effectively removed it all the same.)
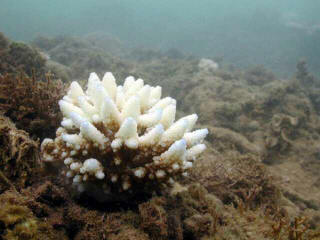 -- Tropical corals are dying in pristine waters. They “bleach” under temperature stress
when the water is at its warmest, although the “causative” temperature extremes have been
tolerated in the past. The corals’ overall resistance is weakening; they are also suffering
from outbreaks of infectious diseases. The physiological changes in the corals dying in
“mass bleaching events” are identical to the changes that occur in food starved corals.
Corals feed on zooplankton washed over them by open ocean water. Trends in
zooplankton abundance in the tropics seem not to have been recorded by scientists,
resources have obviously not been available to track everything....but has the tropical water
become so low in zooplankton that the ocean waves now wash away more than they give to
the corals? Will the corals share their secrets before they disappear? ...Will we ask all the
right questions? (Coral photo courtesy James Wiseman)
-- Tropical corals are dying in pristine waters. They “bleach” under temperature stress
when the water is at its warmest, although the “causative” temperature extremes have been
tolerated in the past. The corals’ overall resistance is weakening; they are also suffering
from outbreaks of infectious diseases. The physiological changes in the corals dying in
“mass bleaching events” are identical to the changes that occur in food starved corals.
Corals feed on zooplankton washed over them by open ocean water. Trends in
zooplankton abundance in the tropics seem not to have been recorded by scientists,
resources have obviously not been available to track everything....but has the tropical water
become so low in zooplankton that the ocean waves now wash away more than they give to
the corals? Will the corals share their secrets before they disappear? ...Will we ask all the
right questions? (Coral photo courtesy James Wiseman)
-- One skinny, wormy codfish may hold more useful information about the “net primary
productivity” of the ocean than all the mathematical models developed by fishery scientists
to date.
An important analogy can be made to the earlier comment that phytoplankton productivity
needs to be assessed in the context of the dynamic ecosystem of which it is a part. It is
relatively easy to appreciate that estimates of the amount of phytoplankton growth
somehow need to be made in the CONTEXT of the co-existing zooplankton-consumer
population.
It makes for a difficult math problem, but the fraction of the production that is being
eaten is a very significant variable.
This same principle applies at all other levels in the marine web, and all are ultimately
reflections of the amount of primary productivity that is being accomplished by the
phytoplankton. Zooplankton production similarly must be assessed in the context of the
abundance of its consumers, and so on...this is how an “ecosystem approach” to stock
assessment must look. Taken out of context, the numbers are useless. The ultimate
conclusion becomes obvious...
THE TOTAL ABUNDANCE OF ALL LEVELS OF LIFE IN THE SEA IS THE
REAL INDEX OF PRIMARY PRODUCTIVITY.
Single stock assessments are futile. Worse than that, they allow us to maintain our tunnel
vision. Currently in Atlantic Canada we have very high abundances of various
crustaceans....yet their consumers, the formerly abundant groundfish, have virtually
disappeared. Statements like “the snow crab population is healthy and being fished in a
sustainable manner” sound ridiculous to anyone concerned about “sustainability” in the
larger sense...in the REAL sense of the word. The crab assessment is being interpreted out
of context, since the fraction of the crab population that is being consumed by its natural predators has dropped to an extremely low level. The marine ecosystem as a whole is in a precarious situation, our mindless
removal of the crustaceans at this point is very risky. (...no, no, bad choice of words in that
last sentence...not “marine ecosystem,” the real thing being risked is the “global
ecosystem”...)
Some scientists are beginning to realize that a creature like a bowhead whale can provide a
“window into the past.” Beyond single animals, groups of animals can do the same thing.
Following is another “window into the past,” one that extends back considerably farther
than the recent bowhead record. This one offers another proxy record of marine primary
productivity.
ONCE THERE WERE MANY FISH, AND THE MANY FISH WERE FAT.
Spencer Appollonio, a past Maine Commissioner of Marine Resources, studied records
from colonial New England and noted that not only were fish described as being
uncommonly abundant in those times, but they were also regularly depicted in the records
as being very “fat.” In an excerpt from his book, Appollonio describes how this fact adds
confusion to present scientific understanding of fish stocks.
“These accounts also suggest that some of our conventional wisdom about “normal” fish
abundances and dynamics may be wrong...
Conventional wisdom tells us that if fish are abundant they are most likely
undernourished, thin, and perhaps in poor condition and stressed because they must be
crowded and competing and pressing upon their food sources. The frequent references
quoted here to big, fat, luscious, abundant fish ought to make us question that wisdom.
There is also presently an assumption that if one species is abundant then another
species must be scarce.
This argument has been made particularly for herring and mackerel. And as part of that
way of thinking there is wide-spread belief among fishermen and scientists alike that fish
species naturally cycle or oscillate in abundances; that populations of fish as a matter of
course show substantial variability or instability -even chaos -and that this happens
regardless of fishing activity. But these historic references over nearly two centuries don't
lend much support to those current ideas.
They may suggest the opposite; that in fact there was remarkable constancy of population
sizes over a long period of time; certainly much longer than there has been scientific
study of fish dynamics. I do not insist upon the truth of these inferences but I do believe
we ought to think seriously about the significance of these historic observations.
The most important point from these historic references is clearly show other important
differences that there was then an abundance of large, old fish within numerous species,
and that there was a significant presence then of species whose abundances are now
negligible. These include sturgeon, salmon. halibut, redfish and quite a few other species.
They also include whales.
In short, there was then an abundance of year classes, sizes, and kinds of species that is
now greatly reduced or largely missing from the Gulf. We might say that there was there
a Quality of fish -an idea to which I will return and expand upon because it is important
-that is now greatly changed. And this raises the possibility that because of the changed
quality of fish in the system that there were things { or functions ) happening then that
are not happening now. This idea of what is now missing from the gulf -both structure
(quality of fish) and function {what is or is not happening) -is central to the point of this
book, and so to this idea also. 1 will frequently return and expand upon at length. For the
moment it is important to bear in mind the possibility that the gulf now is very different
from what it was because of things missing and because of normal functions not
happening.
In summary, these records suggest that fish dynamics and functions of the Gulf of Maine
ecosystems were very different before any significant fishing occurred than they are now
after much fishing has occurred.
The implication is that we are indeed confronted with very perturbed ecosystems that are
very far from stability. This implies that before we can begin to understand how to
manage these systems we have to understand how they came to this condition....
We cannot expect to understand the dynamics of the Gulf of Maine it we think of it only as
it is now. We should not assume that the way it is now is the way it has always been. It is
common practice to do exactly that. We usually assume that a system as we observe it
represents the normal structure and functioning of the system.
If we think about if for a moment, we realize it doesn’t make much sense to assume that a
system that has suffered heavy fishing, as in the Gulf of Maine, is “normal.” We should
more safely assume instead that it is abnormal, and take that likelihood into account....”
(Excerpted from “Searching for Systems in the Gulf of Maine” by Spencer Appollonio.
These excerpts are online at http://www.atlantisforce.org/spencer1.html )
As Appollonio points out, “conventional wisdom” in fishery science was only acquired
after the system had already been greatly altered by fishing activity. Another long,
downward continuum is revealed (FAT TIMES ==> lean times):
1. First there were very many, very fat fish. Large year classes of many species grew plump
simultaneously. Many fish appeared to have plenty to eat.
2. Then, after a lot of fishing had already been done, there was the beginning of fishery
science. Scientists observed that there were fat fish sometimes, and thin fish sometimes. It
was realized that fish were fatter when their numbers were smaller, and thinner when their
abundance was relatively high. The obvious connection was made to feeding. It was
understood as one of the principles operating in the dynamics of fish stocks.
3. Then the “principle” fell apart. Since the early 1980’s fish stocks have increasingly been
exhibiting simultaneous declines in abundance and fat content. And it happened in the
bigger species first. Discovering the reason for this has been one of the major research
challenges in fishery science since the mid-1980s. It has been concluded that fish are
growing more slowly because of “size selective culling pressure” that has been applied by
fishing gear, and because of slight changes in water temperature. The obvious connection
to feeding has been forgotten...or disregarded because of another bit of “conventional
wisdom,” which states that the total marine biomass, and total productivity remain constant.
4. In times past, the survival of fishes was determined by the predation pressure that they
experienced. If something bigger did not eat them, fish grew and prospered, since there
was plenty to eat in the sea. Today, however, survival of fishes is increasingly being
determined by food limitation, and this is a direct, cumulative effect of fishing. Fishery
scientists do not yet realize this, nor extent of the implications involved.
5. Contrary to “conventional wisdom,” the ultimate “plankton soup” will not be very
nutritious.
In fisheries science, fat content of a fish is termed “condition factor.” Assessed overall, it
now becomes evident that the “condition factor” of the ocean in general is dropping. There
is much less living “fat” swimming around in the ocean than there used to be. “Survival of
the leanest” seems now to be an over-riding operating principle. Similarly, competitive advantage is
now determined by the questions “how slow can you grow?” and “how low can you go,
feeding-wise?”
One example of this is the persistence, even expansion, of what appears to be a great
abundance of walleye pollock in the Bering Sea. This fish is a slow-growing plankton
feeder (“slow-growing” also having become a real advantage since plankton has declined).
When the pollock outgrows the size for plankton feeding, it becomes heavily cannibalistic,
feeding on its own juveniles. This particular strategy also now confers a survival advantage
to the species, since as a group they can virtually exist on plankton....which is “as low as
you can go.” And the adult pollock is very lean; fat content in this fish is very low. Richer,
fatter fish are becoming scarce in the Bering Sea (things with higher fat content like herring
and multiple groundfish species). This is why the Steller Sea Lions in the Aleutian Islands
are starving to death, seemingly in the presence of a high biomass of prey (pollock). But
pollock are too poor a food source, they are simply too lean to support sea lions.
(Multimillion dollar research grants have just been announced to study this question - of
why the Steller Sea Lion is threatened by starvation.)
In conclusion, the slow transition from large numbers of big, plump fish...to scant numbers
of small, lean fish, is offered as additional evidence of a long-term change, a gradual loss of
total marine biomass, which has necessarily included a gradual, complementary scaling
back of marine primary productivity. Another piece of supporting evidence lies in the fact
that the predicted global atmospheric change, a rising concentration of CO2, actually did
FOLLOW the removal of the fish.
“The important thing is not to stop questioning.”
-- Albert Einstein
STRANGE CONCLUSIONS
If we carry on with our “management of marine resources,” doing what we’ve become
accustomed to doing, humans will eventually transform the Earth’s ocean into an even
closer approximation of Kenneth Hsu’s “Strangelove ocean” than the one that we have today.
Accelerating instability in natural systems is to be expected; rapid changes will be
everywhere. Scientists warn us today that “mass extinctions” are already occurring in
marine and terrestrial life. However most humans remain oblivious to this reality, and to
the principles that apply to maintaining a sustainable living system. We have long ago
forgotten that we were meant to be a part of “nature,” just another cog in the wheel. We
act as if “nature” is a thing that was given to us to destroy at will. Which is what we have
done and continue to do.
A few million years from now perhaps a core sample of marine sediment will be obtained.
The remains of the original “Strangelove ocean” will still be preserved, the record
documenting the sudden loss of life at the dinosaur extinction. Somewhat closer to the
surface, however, the core will reveal what happened in another blink of time, say from
1500 to 2500 A. D. The signature will be there of the current mass extinction and the
development of a second “Strangelove ocean” characterized by very low marine primary
productivity. Following the mass extinctions will be a time characterized by unusual
plankton blooms, and high atmospheric carbon dioxide...and over the next thousands of
years a diversity of marine organisms will very gradually become re-established.
We may soon reach the end of the experiment; the transformation of the living ocean to
“plankton soup” may occur more quickly than anticipated. This ultimate “plankton soup,”
that marine biologists have predicted for the future ocean, may very well display a bright
green color...but indications are that there’s not going to be very much “meat” swimming
in it, it will be rather thin and watery, not particularly nutritious...and the Earth’s atmosphere may become rather
“hot” by today’s standards. Do we need to worry about this possibility? Is it a realistic fear,
that humans are unwittingly creating a second “Strangelove ocean”...or is this line of
thinking best disregarded as a ridiculous scenario that could only develop in a science
fiction movie?
“Truth is stranger than fiction.”

“The most incomprehensible thing about the world is that it is comprehensible.”
-- Albert Einstein
copyright Debbie MacKenzie, 2001
(A shorter revised version of this
article was added to this site Oct, 2004)
(What do you think about this theory? I'm very interested in a debate, and would appreciate seeing your comments in my guestbook.)
REFERENCES
Appollonio, Spencer. Searching for Systems in the Gulf of Maine
(Excerpts are online at http://www.atlantisforce.org/spencer1.html )
Baes, Charles F. Jr., et al. Uptake of Carbon Dioxide by the Oceans. (in Trabalka, 1985)
Fasham, Michael J. R. Modelling the Marine Biota. (in Heimann, 1993)
Gray, Vincent R. Atmospheric Carbon Dioxide, Greenhouse Bulletin No. 120, Feb 1999
(online at http://www.microtech.com.au/daly/bull120.htm )
Heimann, Martin (ed). The Global Carbon Cycle. NATO Advanced Science Institiutes
Series. Berlin: Springer-Verlag, 1993.
MacKenzie, Debbie. Wake Up and Feed the Fish. 1999
Meyers, Steven D. and James J. O’Brien, 1995. Variations in Mauna Loa carbon dioxide
induced by ENSO. Center for ocean-Atmospheric Prediction Studies. (online at
http://www.coaps.fsu.edu/~meyers/papers/CO2/eos.html )
Mowat, Farley. Sea of Slaughter. Toronto: Bantam Books, 1984.
NASA, 2001. Fung, Inez. Oh Where Oh Where Does the CO2 Go? (online at
http://www.giss.nasa.gov./research/intro/fung.01/index.html )
Olson, Jerry S., et al. The Natural Carbon Cycle. (in Trabalka, 1985)
Rotty, Ralph M. and Charles D. Masters. Carbon Dioxide from Fossil Fuel Combustion:
Trends, Resources, and Technological Implications. (in Trabalka, 1985)
Sakshaug, E. et at. 1997. Parameters of photosynthesis: definitions, theory and
interpretation of results. Journal of Plankton Research, 19(11), 1637-1670 (online at
http://ads.smr.uib.no/jgpfs/publications/on-line/jgofs27.pdf )
Shaffer, Gary. Effects of the Marine Biota on Global Carbon Cycling. (in Heimann, 1993.)
Siegenthaler, Ulrich. Modelling the Present-Day Oceanic Carbon Cycle. (in Heimann,
1993)
Trabalka, John R. (ed). Atmospheric Carbon Dioxide and the Global Carbon Cycle.
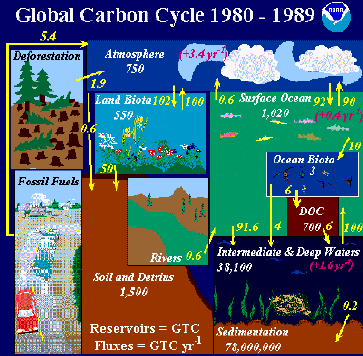
United States Department of Energy. DOE/ER-0239, December 1985. (scanned graphs above were taken from this source)
______“Oral History...Straight From the Whale’s Mouth” (online at
http://www.discovery.com/news/features/whales/whales.html )